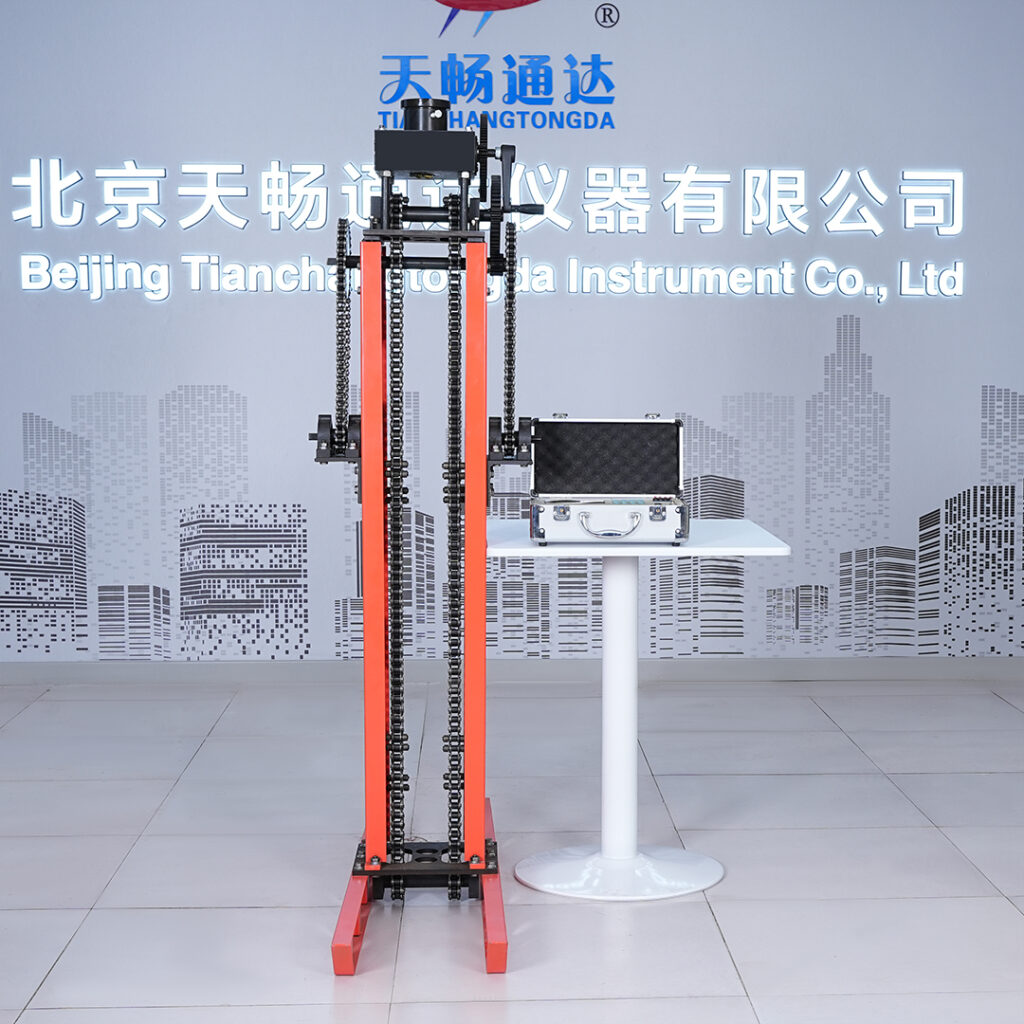
The Static Cone Penetrometer (SCPT) is widely used for in-situ soil investigation due to its precision and real-time data output. However, collecting data is only half the job—the other half is knowing how to read, interpret, and apply those test results effectively.
In this guide, we’ll walk you through each key parameter measured by a static cone penetrometer, explain what the values mean, and show you how to use the data to assess soil strength, layering, and suitability for construction.
Whether you’re a new field engineer or a decision-maker reviewing test reports, this article will help you make confident and data-driven decisions based on SCPT results.
📊 Key Parameters Measured by a Static Cone Penetrometer
1. Cone Resistance (qc)
- Measures the resistance of soil to cone penetration.
- Units: MPa or kPa
- Indicates soil strength and bearing capacity.
- Higher qc = stronger soil.
2. Sleeve Friction (fs)
- Measures side resistance on the penetrometer’s sleeve.
- Units: MPa or kPa
- Helps identify soil type and soil stiffness.
3. Friction Ratio (Rf)
- Rf = (fs / qc) × 100%
- Expressed as a percentage
- Distinguishes between cohesive and non-cohesive soils:
- Low Rf (<1%) → sand or gravel
- High Rf (>3%) → clay or silt
4. Depth Intervals
- Recorded every 10 cm or less.
- Used to build stratigraphy profiles and identify soil layer transitions.
💡 Our Static Cone Penetrometer provides real-time display of up to 10 depth intervals simultaneously, improving field interpretation accuracy.
Learn more on the product page.
📈 Step-by-Step: How to Read SCPT Data
Step 1: Review the Depth Profile
- Look at the qc and fs values across depth intervals.
- Plot these values against depth to visualize soil layering.
- Watch for sudden drops or spikes that indicate layer transitions.
Step 2: Calculate Friction Ratios
- Use Rf to distinguish soil types:
- Rf < 1% → granular soil
- Rf 1–2.5% → transitional soils
- Rf > 3% → clay
✅ Tip: Our SCPT auto-calculates Rf and displays it directly on the screen.
Step 3: Identify Layer Boundaries
- Transition from soft to dense soil → sudden increase in qc.
- Consistent low qc + high fs → cohesive layers.
- High qc + low fs → compact sand or gravel.
Step 4: Assess Bearing Capacity
- Use empirical correlations (e.g., Terzaghi or Schmertmann methods) to estimate allowable bearing pressure.
- Adjust safety factors based on project risk.
📲 Want a spreadsheet or software recommendation for calculating bearing capacity? Ask our team directly on WhatsApp
📋 Example Interpretation
Here’s a simplified SCPT data segment:
| Depth (m) | qc (MPa) | fs (kPa) | Rf (%) | Soil Type |
|---|---|---|---|---|
| 0.0–0.5 | 1.2 | 40 | 3.3 | Clay |
| 0.5–1.0 | 2.8 | 35 | 1.3 | Silty Sand |
| 1.0–1.5 | 4.5 | 20 | 0.4 | Dense Sand |
| 1.5–2.0 | 3.6 | 100 | 2.8 | Clayey Silt |
🧠 Interpretation: Soil profile transitions from soft clay → silty sand → dense sand → cohesive silt.
This layering informs foundation design, footing placement, and compaction strategy.
⚠️ Common Interpretation Mistakes to Avoid
| Mistake | Fix |
|---|---|
| ❌ Ignoring friction ratio | Always analyze Rf for soil classification |
| ❌ Misreading sudden qc spikes | May be obstructions or gravel, not better soil |
| ❌ Overgeneralizing data | Analyze per site and correlate with local geology |
| ❌ Using old empirical formulas blindly | Update methods based on regional codes and standards |
🧪 How Our Penetrometer Improves Data Interpretation
Our SCPT is built to support efficient and accurate analysis in the field:
- ✅ 1/20000 resolution, ±0.1% accuracy
- ✅ Built-in multi-depth display (10 values)
- ✅ Internal storage for multiple full test logs
- ✅ Direct USB/RS232 data export
- ✅ Optional probe support for pore pressure & cross-plate readings
You can immediately review results on-site or export data for further analysis.
🌐 View full details: Static Cone Penetrometer Product Page
💬 FAQs
Q1: Is SCPT data accepted by building authorities?
Yes — SCPT is recognized worldwide and often required for high-rise, bridge, or deep foundation design.
Q2: How often should I calibrate my penetrometer?
Before each project or after long storage. Our device allows quick zero-setting and sensor verification.
Q3: What software can help analyze SCPT data?
Generic tools like Excel, CPT software (e.g., Geologismiki, Rocscience), or custom import to CAD/GIS are all useful.
💬 Still unsure? Chat with us directly on WhatsApp for guidance.
📞 Ready to Collect and Interpret SCPT Data with Confidence?
Let our equipment give you the clarity and consistency your project demands.
- 📍 Product link: Static Cone Penetrometer
- 💬 Instant support: Chat via WhatsApp
- 🌐 More solutions: Visit Homepage
Data is only powerful if you know how to read it.
With our Static Cone Penetrometer, you don’t just get numbers —
you get insights that build stronger foundations.
